Home » Flood mitigation » Floodplain management » Water quality in the Richmond
Water quality in the Richmond
Richmond River water quality impacts of early 2022
Following the severe flooding of early 2022, firstly at the end of February and then again at the end of March, Rous County Council staff have been inspecting our flood mitigation assets and monitoring environmental conditions across the floodplain. The flooding was catastrophic in scale and damage, and we are still carrying out repairs to flood mitigation infrastructure across the floodplain. While many water quality parameters are slowly beginning to improve (as of June 2022), the long-term impacts of the flooding on water quality and general estuary health are still to be determined.
There has been significant damage to the river system, the environment, agriculture and the built environment throughout the lower Richmond River area.
Indicative images describing the response to the lower Richmond River to the late February flood are provided below.
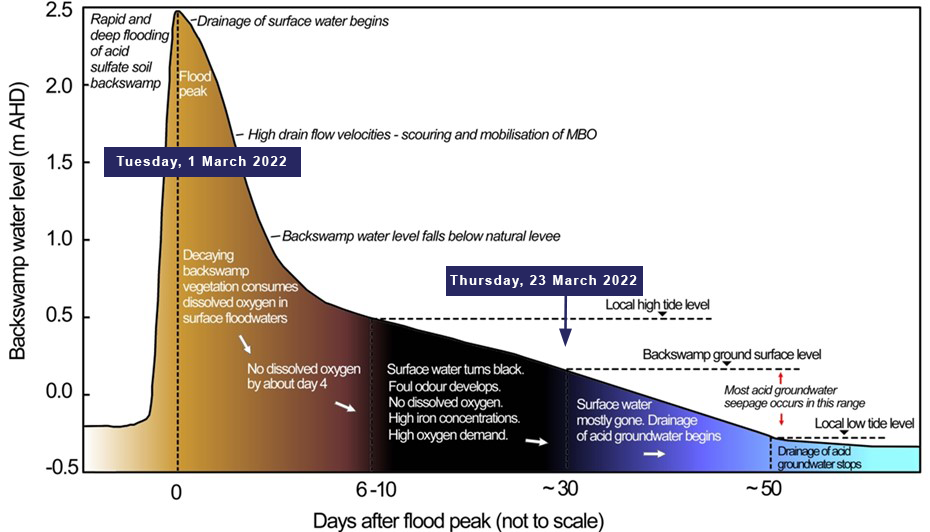
Source: General sequence of changes to water quality after deep floodplain inundation as in Johnston, S. et al (2003) Restoring the balance: guidelines for managing floodgates and drainage systems on coastal floodplains. NSW Agriculture, Wollongbar.
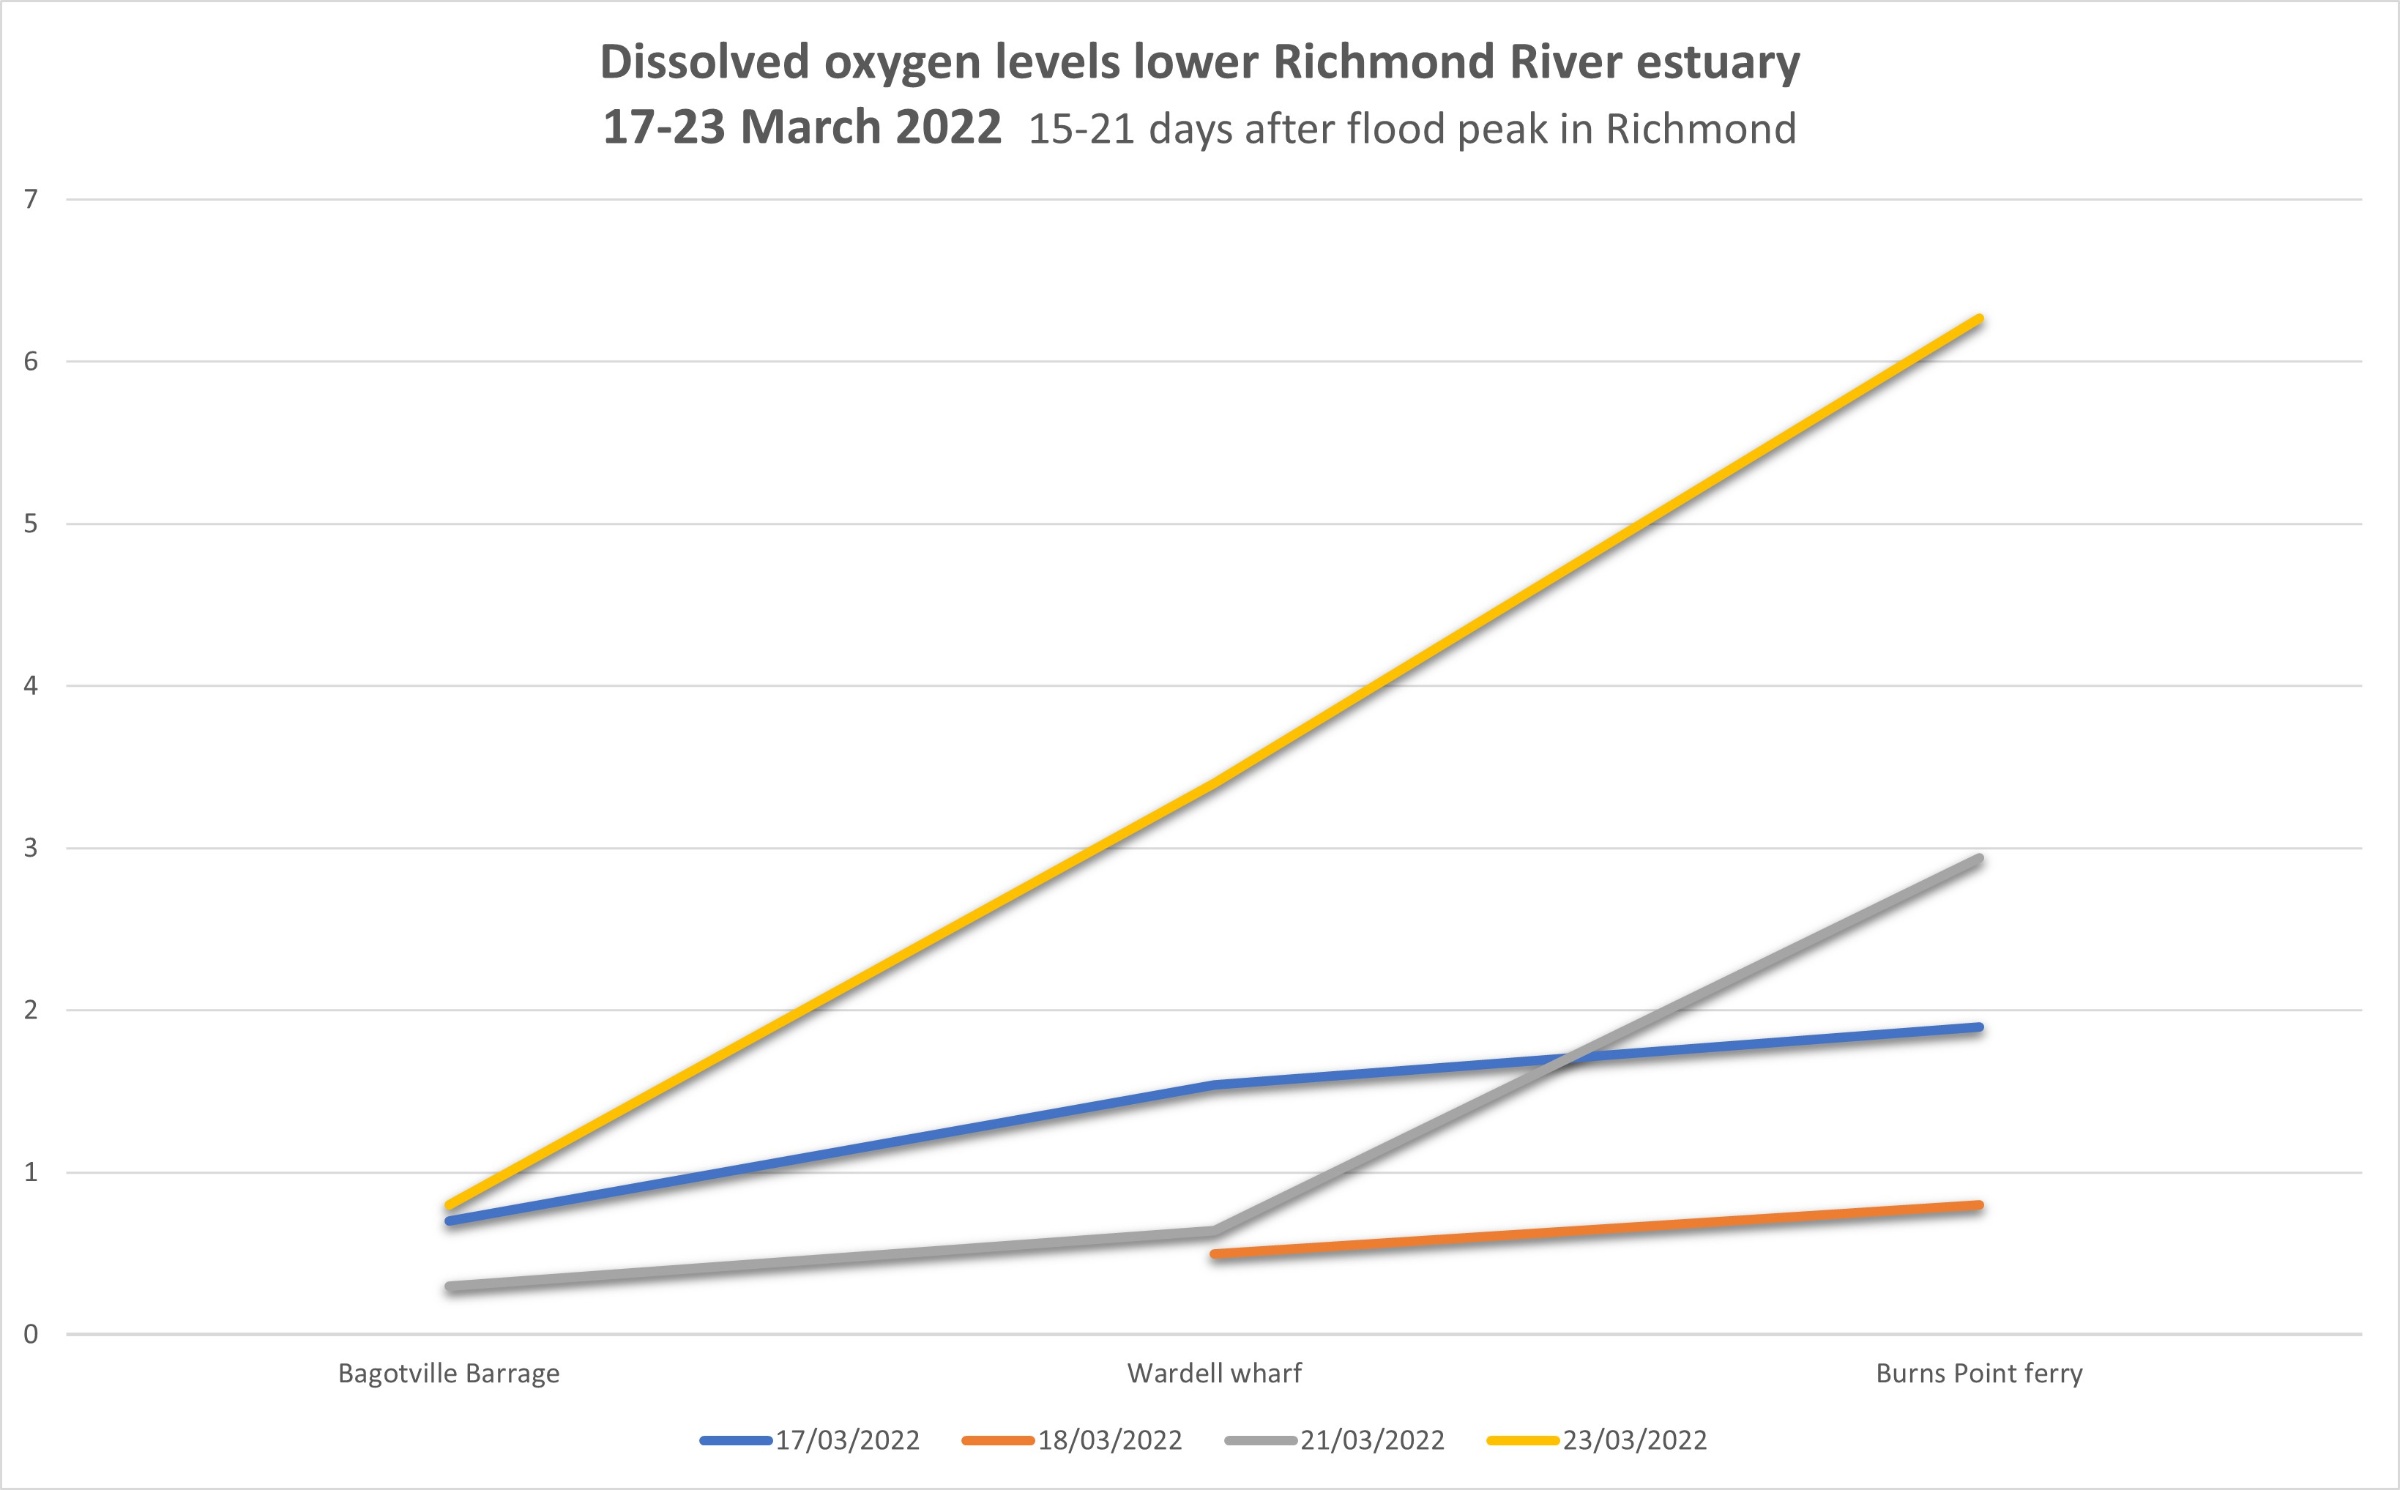
Unfortunately some water quality monitoring assets were lost during the flood and in response the Department of Planning and Environment (DPE) and Rous County Council installed temporary water quality loggers and undertook hand sampling and inspections where physically possible and safe to do so, in order to obtain as much information as possible about water quality conditions.
Key data related to the flood and its immediate aftermath on water quality are summarised in the following report from DPE, and in the updates regarding temporary loggers installed and maintained by Southern Cross University. Data from temporary loggers will continue to be provided where available and is intended to partly fill the gap in information while the permanent monitoring sites are repaired.
Post-flood water quality and fish kill assessment, Richmond River February-May 2022
Richmond River Water Quality Update 2 May 2022
Richmond River Water Quality Update 28 June 2022
Richmond River Water Quality Update 24 November 2022
Water quality monitoring in the Richmond
Rous County Council takes a leading role in water quality monitoring in the Richmond and has commenced a new partnership with the NSW Department of Planning Industry and Environment (DPIE) and Southern Cross University (SCU). As part of this role, Rous County Council has installed a new system of water quality data loggers in the lower Richmond River.
These permanent monitoring sites measure pH, salinity, temperature, dissolved oxygen and turbidity.
Results from the new data loggers are available at this water quality dashboard and shown on the summary map.
Disclaimer:
March 2024: Readings for the following loggers are currently out of specification and should not be used:
- North Creek Upstream – Dissolved Oxygen and EC.
- Wardell – Turbidity.
"The water quality dashboard contains live data and information that is not actively reviewed. Accordingly, Council does not certify the accuracy of the data and information or warrant that it is free from error or omission. The data and information is provided for general information purposes only and should not be construed as professional, specialist or technical advice. Any reliance placed on the data and information shall be at the sole risk of the user and the accuracy of the data and information should be verified prior to using it.
The data and information contained in the water quality dashboard will periodically be reviewed and the subsequent QA/QC data reports made available via this webpage as they become available. While all reasonable care will be taken in reviewing the data contained in these reports, similarly, no warranty will be given that the review and the reports are free from error or omission."
Significant damage was incurred to several monitoring sites due to the impact of the February 2022 flood in the lower Richmond River. These sites are repaired and will return to operation as soon as possible.
This monitoring project is possible due to Rous securing a 3-year grant under the NSW Coast and Estuary Grants program titled 'Richmond River water quality monitoring project', for implementation from 2020. The project has been developed through consultation with our constituent councils, technical advice from DPE, SCU and the UNSW Water Research Laboratory. A summary and interpretation of results from the first two years of this monitoring are provided here: Year 1 Annual Report; Year 2 Annual Report.
Richmond River salinity results
November 2020: Current real time data of salinity in the Richmond River can be accessed from two locations (Coraki and Oakland Road) at the WaterNSW website.
Search under the Rivers and Streams option and navigate to the Richmond River via the online map. The two-point source locations of Coraki and Oakland Road provide current salinity results.
Real time dataloggers being deployed by Rous County Council late in 2020 will measure salinity at two further lower river locations, being Wardell and Woodburn. A user-friendly summary of real time salinity levels in the lower river, combining the two WaterNSW and Rous County Council sites, will be provided in 2021 and displayed on this website.
Local Land Services can provide assistance to landholders regarding acceptable salinity levels for stock and irrigation purposes. See Water for livestock: Interpreting water quality tests or contact Local Land Services for more information. Best practice for landholders is to obtain a handheld salinity meter to test river salinity prior to any drawing of water for livestock or irrigation purposes. Suitable salinity meters range in price from around $100-$300 and are available at numerous locations online.
Historical water quality data
The Richmond River’s water quality is influenced by natural processes such as the tide, rainfall and season, and by anthropogenic (human induced) clearing, draining and management, which can result in high nutrients, turbid water, acid water and blackwater. This link to turbidity shows filtered samples of river water before and after rain. Historical water quality data is available below, or please see this Review of Water Quality in Rocky Mouth Creek.
Historical water quality monitoring graphs
| 2020 | Coraki | Kilgin | Rocky Mouth Creek | Swan Bay | Woodburn | Bagotville Barrage |
| 2019 | Coraki | Kilgin | Rocky Mouth Creek | Swan Bay | Woodburn | Bagotville Barrage |
| 2018 | Coraki | Kilgin | Rocky Mouth Creek | Swan Bay | Woodburn | Bagotville Barrage |
| 2017 | Coraki | Kilgin | Rocky Mouth Creek | Swan Bay | Woodburn | Bagotville Barrage |
| 2016 | Coraki | Kilgin | Rocky Mouth Creek | Swan Bay | Woodburn | Bagotville Barrage |
| Note: Records are available dating from 2013. | ||||||
Historical salinity reports
| 2020 | January | February | March | April | May | June |
| July | August | September | October | November | December | |
| 2019 | January | February | March | April | May | June |
| July | August | September | October | November | December | |
| 2018 | January | February | March | April | May | June |
| July | August | September | October | November | December |
12-month historical water quality data
| January 2020 | Summary | ||||
| December 2019 | Summary | ||||
| November 2019 | Summary | ||||
| October 2019 | Summary | ||||
| September 2019 | Summary | ||||
| August 2019 | Tuckean Swamp Site 1 |
Tuckean Swamp Site 2 |
Tuckean Swamp Site 4 |
Rocky Mouth Creek | |
| July 2019 | Tuckean Swamp Site 1 |
Tuckean Swamp Site 2 |
Tuckean Swamp Site 4 |
Rocky Mouth Creek | |
| June 2019 | Tuckean Swamp Site 1 |
Tuckean Swamp Site 2 |
Tuckean Swamp Site 4 |
Rocky Mouth Creek | |
| May 2019 | Tuckean Swamp Site 1 |
Tuckean Swamp Site 2 |
Tuckean Swamp Site 4 |
Rocky Mouth Creek | |
| April 2019 | Tuckean Swamp Site 1 |
Tuckean Swamp Site 2 |
Tuckean Swamp Site 4 |
Rocky Mouth Creek | North Creek |
| March 2019 | Tuckean Swamp Site 1 |
Tuckean Swamp Site 2 |
Tuckean Swamp Site 4 |
Rocky Mouth Creek | |
| February 2019 | Tuckean Swamp Site 1 |
Tuckean Swamp Site 2 |
Tuckean Swamp Site 4 |
Rocky Mouth Creek | North Creek |
These parameters are used in the above data graphs to determine water quality levels:
- Electrical conductivity
Electrical conductivity (EC) is a measure of the concentration of ion in solution. EC is temperature-dependant (increasing approximately 2-3% per degree Celsius). International convention dictated that the measurements are to be standardised to 15oC; this is known as specific conductivity. The electrical conductivity of sea water is 55-60mS/cm, which converts to 35 parts per thousand (ppt). EC below 1.8mS/cm is considered fresh by the Australian and New Zealand Environment Conservation Council (ANZECC) Water Quality Guidelines.
- pH
pH is a measure of acidity/alkalinity, with values ranging from 0 to 14. pH; values below 7 indicate acidic conditions. ANZECC guidelines for the protection of aquatic ecosystems indicated that a pH range between 6.5 and 9 is acceptable.
- Dissolved oxygen
Dissolved oxygen (DO) in terms of mg/L is a measure of the concentration of oxygen dissolved into the water. The concentration of oxygen in water can be influenced by temperature, pressure and ionic concentration. The DO concentration can vary greatly with biological activity. ANZECC guidelines recommend that DO is above 6mg/L over a diurnal cycle. DO is one of the most important water quality parameters to measure the health of a water body.
- Temperature
The ANZECC guidelines for the protection of aquatic ecosystems for temperature of fresh and marine waters is <2oC change. While for a fully marine system this sounds reasonable, most waterways can vary up to 10oC over the daily cycle, as a result of solar radiation inputs and convection by atmospheric temperature. This is especially noticeable in shallow or stratified waters without shading riparian vegetation.
- Total dissolved solids (TDS)
TDS is a measure of the combined content of all inorganic and organic dissolved molecular, ionized or suspended micro-granular substances in the water, including minerals, salts or metals measured in parts per thousand (ppt).
- Turbidity
Turbidity is a measure used to quantify the degree to which light travelling through the water column is scattered by suspended particles. Increasing turbidity will reduce light penetration into a water body, and therefore have a detrimental effect on the potential for photosynthesis. If turbidity is mainly caused by organic particles, there is a high risk of oxygen depletion.The ANZECC guidelines for the protection of aquatic ecosystems for turbidity of fresh and marine waters is <10% seasonal change. This idea of seasonal change allows for flood events where there is an increase suspended load that will be settled out after the fresh has passed.
- Water level
This parameter measures the rises and falls in water level. These variations can be attributed to the incoming and outgoing tides, as well as rainfall events.
- Rainfall
Rainfall is often a trigger for changes in water quality.
Definition sources: Manly Hydraulics Laboratory.